Friday, November 13, 2026


High Tide Inc., September 14, 2026

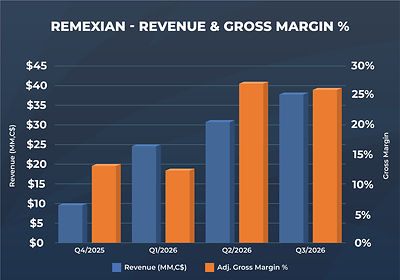
Remexian - Revenue & Gross Margin %

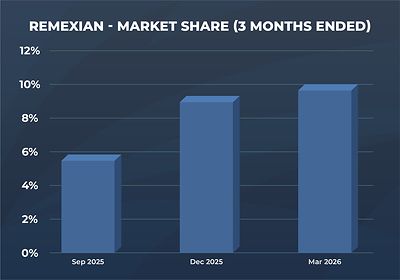
Remexian - Market Share (3 Months Ended)

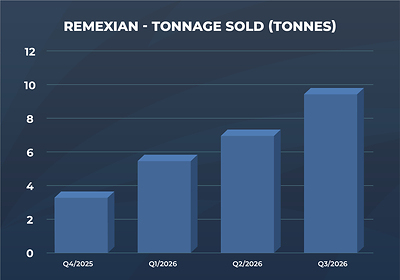
Remexian - Tonnage Sold (Tonnes)

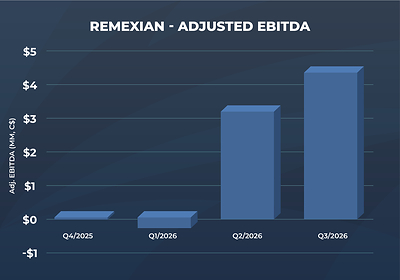
Remexian - Adjusted EBITDA

High Tide Inc. Logo


CALGARY, AB, Sept. 14, 2026 /PRNewswire/ -- High Tide Inc. ("High Tide" or the "Company") (Nasdaq: HITI) (TSXV: HITI) (FSE: 2LYA), the high-impact, retail-forward enterprise built to deliver real-world value across every component of cannabis, today released its financial results for the third fiscal quarter of 2026 ended July 31, 2026, the highlights of which are included in this news release. The full set of unaudited condensed interim consolidated financial statements for the three months ended July 31, 2026 and 2025 (the "Financial Statements") and accompanying management's discussion and analysis can be accessed by visiting the Company's website at www.hightideinc.com, its profile pages on SEDAR+ at www.sedarplus.ca, and EDGAR at www.sec.gov/edgar.
"Nearly every major financial metric moved in the right direction this quarter, with many reaching the highest levels in our history. We delivered record revenue, record gross profit, record Adjusted EBITDA, record income from operations, record net income and record operating cash flow before working capital. But what excites me most is that our bottom line is now growing substantially faster than our top line. That is the operating leverage we have spent years building toward," said Raj Grover, Founder and Chief Executive Officer of High Tide.
"High Tide is approaching an $800 million annualized revenue run rate, our Adjusted EBITDA margin is at its highest level in twelve quarters, and we continue to generate meaningful free cash flow while investing aggressively in growth. With Canna Cabana strengthening its leadership position in Canada and Remexian scaling rapidly in Germany, we now have two powerful engines driving our business forward. We intend to keep pushing hard on growth, profitability and cash generation while maintaining the capital discipline that got us here. This quarter is the clearest evidence yet of the earnings power we are building at High Tide," added Mr. Grover.
Third Fiscal Quarter 2026 – Financial Highlights:
Third Fiscal Quarter 2026 – Retail Highlights:
Third Fiscal Quarter 2026 – Medical Cannabis Update
Third Fiscal Quarter 2026 – Operational Highlights (May 1, 2026 – July 31, 2026):
Subsequent Events (August 1, 2026 – Present):
Selected financial information for the three and nine months ended, July 31, 2026:
(Expressed in thousands of Canadian Dollars)
Three months ended July 31, | Nine months ended July 31, | ||||||||||
2026 | 2025 | Change | 2026 | 2025 | Change | ||||||
$ | $ | ∆ | $ | $ | ∆ | ||||||
Free cash flow(i) | 7,017 | 7,682 | (9) % | 11,438 | 10,678 | 7 % | |||||
Net cash provided by operating activities | 10,091 | 10,650 | (5) % | 20,384 | 19,588 | 4 % | |||||
Revenue | 198,818 | 149,690 | 33 % | 556,443 | 429,955 | 29 % | |||||
Gross profit | 52,746 | 40,091 | 32 % | 145,546 | 111,002 | 31 % | |||||
Gross margin(ii) | 27 % | 27 % | — % | 26 % | 26 % | — % | |||||
Operating expense(iii) | (36,514) | (29,448) | 24 % | (105,423) | (85,208) | 24 % | |||||
Operating expense as a % of revenue(iv) | 18 % | 20 % | (2) % | 19 % | 20 % | (1) % | |||||
Total expenses | (44,036) | (36,352) | 21 % | (128,368) | (106,264) | 21 % | |||||
Income from operations | 8,710 | 3,739 | 133 % | 17,178 | 4,738 | 263 % | |||||
Adjusted EBITDA(v) | 16,232 | 10,643 | 53 % | 41,605 | 25,794 | 61 % | |||||
Adjusted EBITDA as a percentage of revenue(vi) | 8 % | 7 % | 1 % | 7 % | 6 % | 1 % | |||||
Net income (loss) | 12,748 | 832 | — % | 12,420 | (4,693) | — % | |||||
Adjusted net income (loss)(vii) | 2,246 | 875 | 157 % | (606) | (4,650) | (87) % | |||||
Basic income (loss) per share | 0.13 | 0.01 | — % | 0.14 | (0.06) | — % | |||||
Diluted income (loss) per share | 0.12 | 0.01 | — % | 0.13 | (0.06) | — % | |||||
i. Free cash flow is a non-IFRS financial measure prepared based on the calculation below. |
ii. Gross margin is a non-IFRS financial measure. Gross margin is calculated by dividing gross profit by revenue. |
iii. Operating expense is a non-IFRS measure and includes salaries, wages and benefits, general & administration, professional fees, advertising & promotion, and interest & bank charges. |
iv. Operating expense as a % of revenue is a non-IFRS financial measure. This metric is calculated as operating expense divided by revenue. |
v. Adjusted EBITDA is a non-IFRS financial measure. A reconciliation of the Adjusted EBITDA to Net income (loss) is found below. |
vi. Adjusted EBITDA as a percentage of revenue is a non-IFRS financial measure. This metric is calculated as adjusted EBITDA divided by revenue. |
vii. Adjusted net income (loss) is a non-IFRS financial measure calculated by excluding the fair value changes in the derivative liability and long-term contract asset from net income (loss). |
The reconciling items between net earnings, EBITDA, and Adjusted EBITDA are as follows:
2026 | 2025 | 2024 | ||||||
Q3 | Q2 | Q1 | Q4 | Q3 | Q2 | Q1 | Q4 | |
Net (loss) Income | 12,748 | 24 | (352) | (46,711) | 832 | (2,836) | (2,689) | (4,802) |
Income/deferred tax (recovery) expense | (93) | 295 | 40 | (178) | 69 | 46 | 38 | (153) |
Accretion and interest | 3,531 | 3,151 | 3,155 | 1,213 | 1,795 | 1,950 | 2,101 | 2,308 |
Depreciation and amortization | 6,644 | 6,146 | 8,026 | 6,503 | 6,080 | 5,880 | 5,847 | 5,362 |
EBITDA(i) | 22,830 | 9,616 | 10,869 | (39,173) | 8,776 | 5,040 | 5,297 | 2,715 |
Inventory fair value | - | 792 | 690 | 865 | — | — | — | — |
Foreign exchange loss (gain) | 979 | (212) | (144) | 333 | 120 | 114 | (13) | 5 |
Transaction and acquisition costs | 2,047 | 2,077 | 2,958 | 2,682 | 881 | 1,616 | 630 | 773 |
Other (gain) loss | — | — | — | (41) | (1) | 42 | — | (874) |
Impairment loss | — | — | — | 23,564 | — | — | — | 4,964 |
Share-based compensation | 878 | 881 | 370 | 668 | 824 | 1,250 | 1,175 | 750 |
(Gain) loss on fair value change in derivative liability | (11,787) | 762 | (3,286) | 23,516 | 43 | — | — | (88) |
Loss on fair value change in long term contract asset | 1,285 | — | — | — | — | — | — | — |
Adjusted EBITDA(i) | 16,232 | 13,916 | 11,457 | 12,414 | 10,643 | 8,062 | 7,089 | 8,245 |
Adjusted EBITDA margin(ii) | 8 % | 8 % | 6 % | 8 % | 7 % | 6 % | 5 % | 6 % |
Adjusted EBITDA - trailing twelve months | 54,019 | 48,430 | 42,576 | 38,208 | 34,039 | 33,010 | 34,989 | 38,335 |
i. EBITDA and Adjusted EBITDA are non-IFRS financial measures. |
ii. Adjusted EBITDA margin is a non-IFRS financial measure. This metric is calculated as Adjusted EBITDA divided by revenue. |
2026 | 2025 | 2024 | ||||||
Q3 | Q2 | Q1 | Q4 | Q3 | Q2 | Q1 | Q4 | |
Cash flow from operating activities | 11,886 | 8,752 | 5,486 | 6,599 | 8,231 | 4,686 | 4,644 | 6,179 |
Changes in non-cash working capital | (1,795) | (4,319) | 374 | (2,321) | 2,419 | 3,569 | (3,961) | 3,473 |
Net cash provided by operating activities | 10,091 | 4,433 | 5,860 | 4,278 | 10,650 | 8,255 | 683 | 9,652 |
Sustaining capex | (492) | (289) | (286) | (345) | (460) | (692) | (361) | (533) |
Lease liability payments | (2,582) | (2,662) | (2,635) | (2,610) | (2,508) | (2,667) | (2,222) | (3,211) |
Free cash flow(i) | 7,017 | 1,482 | 2,939 | 1,323 | 7,682 | 4,896 | (1,900) | 5,908 |
Free cash flow - trailing twelve months | 12,761 | 13,426 | 16,840 | 12,001 | 16,586 | 11,996 | 16,483 | 21,991 |
i. Free cash flow is a non-IFRS measure. |
OUTLOOK
Bricks-and-Mortar Retail
High Tide's wholly owned subsidiary, Canna Cabana, is the largest cannabis retail chain in Canada with 232 locations. Canna Cabana also owns and operates a location in Berlin, Germany, selling consumption accessories. As previously communicated, the Company reiterates its long-term goal of surpassing 350 locations across Canada and opening over 20 locations in calendar 2026, mostly through organic growth, while also evaluating supplemental M&A opportunities of varying sizes.
White Label Initiatives
The Company continues to expand its white label cannabis product portfolio under its flagship Queen of Bud and Cabana Cannabis Co. brands, increasing from 41 to 48 SKUs sequentially. The Company is also developing several new offerings to further grow its white label portfolio. Currently, white label cannabis SKUs represent approximately 1.9% of the Company's total bricks-and-mortar cannabis sales. Over the long term, the Company anticipates significant growth in its white label portfolio.
Cabana Club & ELITE
The Company's Cabana Club and ELITE loyalty programs, which remain the largest such cannabis loyalty programs in the world, continue to expand at a rapid pace across Canada. Cabana Club membership has now surpassed 2.73 million members in Canada, which is up 27% in the past year. Over the long term the Company anticipates exceeding 3 million Cabana Club members in Canada. ELITE, the paid membership tier now exceeds 186,000 members in Canada—after growing by 62% compared to last year—with additional members being onboarded daily.
Europe
High Tide's German medical cannabis subsidiary, Remexian Pharma GmbH, has continued to gain momentum since the Company's acquisition of a majority stake, with market share increasing from 6.5% to 10.5% in the first six months post transaction. The Company notes that while industry data isn't available, Remexian's shipments have increased 44% since the three months ended March 31, 2026. Management is encouraged by this strong and increasingly bullish trajectory and believes the Company is well positioned to sustain, and potentially grow, its share of the German medical cannabis market, supported by its unmatched Canadian supply relationships and the continued growth of Germany's medical cannabis sector. The record tonnage distributed by Remexian during the third fiscal quarter provides further evidence of this positive momentum and, assuming the current regulatory framework remains materially unchanged, could be indicative of the scale and growth potential of the business in the quarters ahead. The Company continues to assess potential opportunities in other European jurisdictions, and is committed to being strategic on any entry with the aim of maximizing shareholder value.
United States
The Company's conviction in the long-term opportunity for its U.S. hemp-derived CBD subsidiaries continues to be reinforced by an evolving federal policy environment. Consistent with the rationale behind becoming founding members of the U.S. National Compassionate Care Council, the Company and its subsidiary, NuLeaf Naturals, remain focused on helping to shape thoughtful federal and state medical cannabis policy while supporting efforts to expand patient access to cannabinoid therapies.
Federal reform in the U.S. has continued to accelerate. On April 23, 2026, the U.S. Department of Justice and Drug Enforcement Administration (DEA) moved FDA-approved cannabis drug products and cannabis subject to a state medical marijuana license from Schedule I to Schedule III of the Controlled Substances Act, the most significant shift in U.S. federal cannabis regulation in decades. Building on that order, the DEA conducted an administrative hearing between June 29 and July 15, 2026, to consider the broader rescheduling of cannabis from Schedule I to Schedule III.
The Company believes that broader rescheduling, if ultimately implemented, could have significant implications for the U.S. cannabis industry, including t


Comments
No comments on this item Please log in to comment by clicking here